
Diagrams
Visual diagrams of systems, tables and mappings, derived automatically from live metadata so documentation never drifts from reality.
The estate as a picture
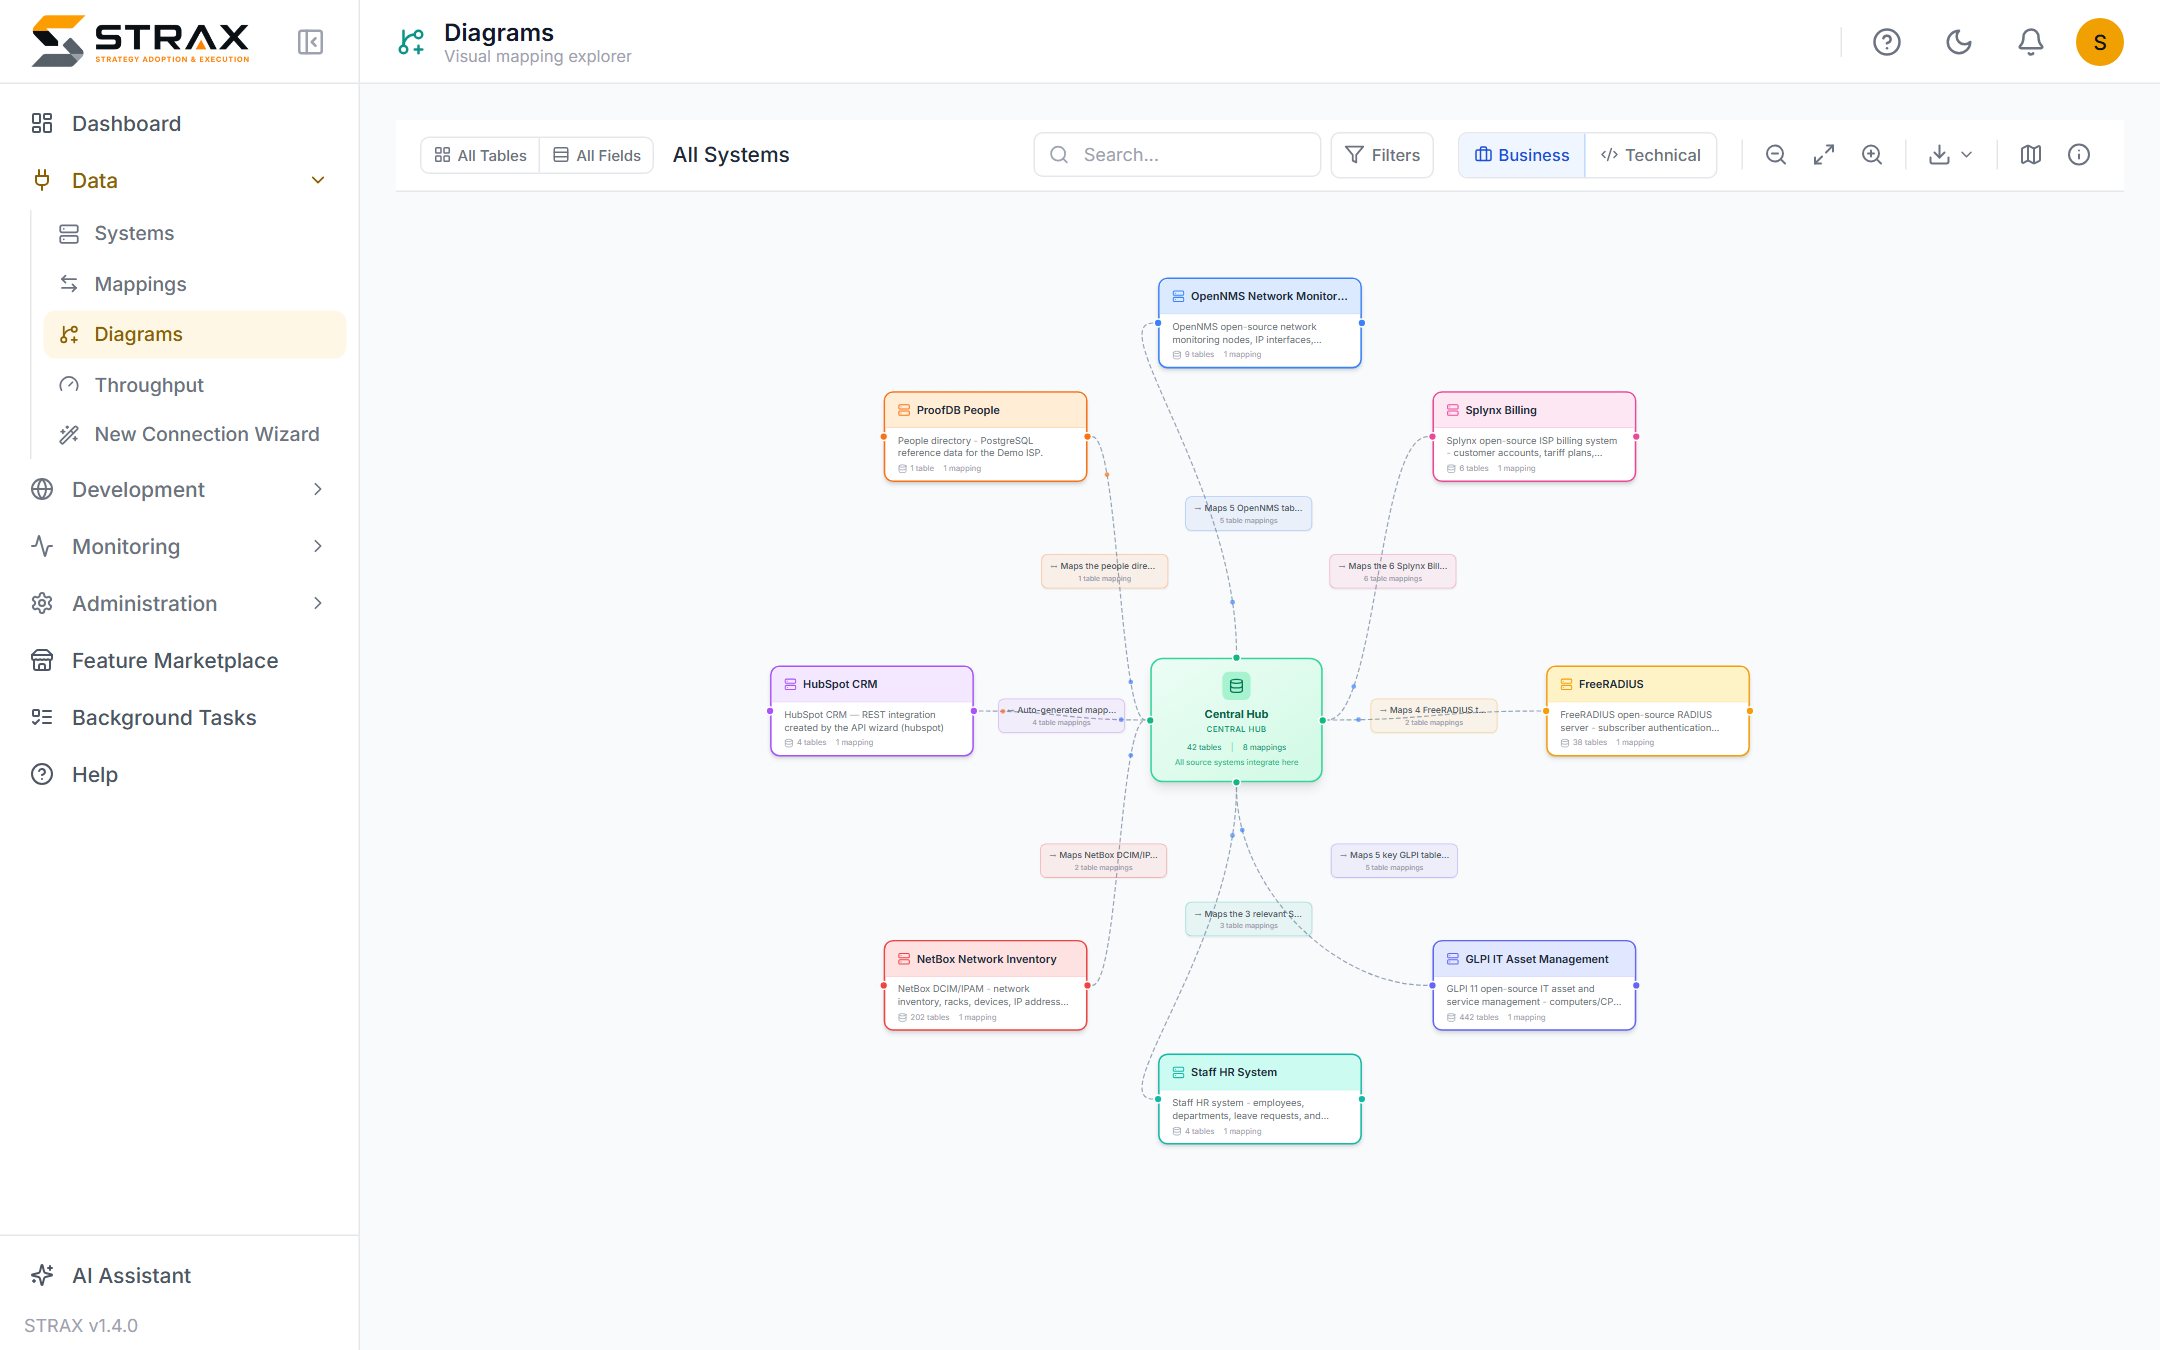
STRAX draws your integration estate for you. The diagram explorer shows every connected system, the tables inside it, and the mappings that tie each one to the canonical model. You can start from the whole estate for orientation, narrow to a single system, and open any table or mapping in detail. Most screens in the console also carry a direct View diagram action, so the picture for the record you are looking at is one click away.
Different questions call for different views. A system view answers "what does Splynx exchange with the hub". A mapping view shows a source table and its canonical counterpart field by field. A field view traces one value back to where it originates, which is the view to reach for when someone asks why a customer's email in Zendesk differs from the one in HubSpot.
Documentation that cannot go stale
Hand-drawn architecture diagrams are out of date the week after they are drawn. STRAX diagrams are different in kind: they are derived automatically from the platform's own metadata, generated fresh each time they are viewed. The diagram is not a drawing of the integration; it is the integration, rendered. When a mapping changes, the picture changes with it, and there is no separate document to forget to update.
This inverts the usual relationship between documentation and reality. Where a diagram does not match what you expected, the diagram is telling the truth and the expectation is what needs examining.
Onboarding and audits
The diagrams earn their keep with the people who do not use the console daily.
A new engineer at Demo ISP can see in an afternoon what previously lived in the heads of two long-serving staff: which systems exist, what each contributes, and how a customer record travels from Splynx through the hub to HubSpot and Zendesk. The picture replaces weeks of oral tradition.
Auditors and compliance reviewers ask where personal data is held and where it flows. Because the diagrams are generated from the live configuration, they are evidence rather than assertion. The field-level view shows the exact path a data item takes, current as of the moment it is rendered, which is a materially stronger answer than a diagram somebody drew last year.
The same diagrams support design reviews and vendor replacement planning. Before Demo ISP swaps its support desk, the system view shows precisely what the outgoing product exchanges with the hub, which becomes the checklist for its successor.
Part of the metadata, everywhere
Diagrams travel with the metadata they describe. They appear in generated documentation and exports, and a hand-drawn context diagram can be stored alongside the generated ones in a system's description where extra narrative helps.
Diagrams visualise what connecting systems discovers and what mapping data defines. For the concepts behind the pictures, see How STRAX works, or request a demonstration to see your own estate drawn live.